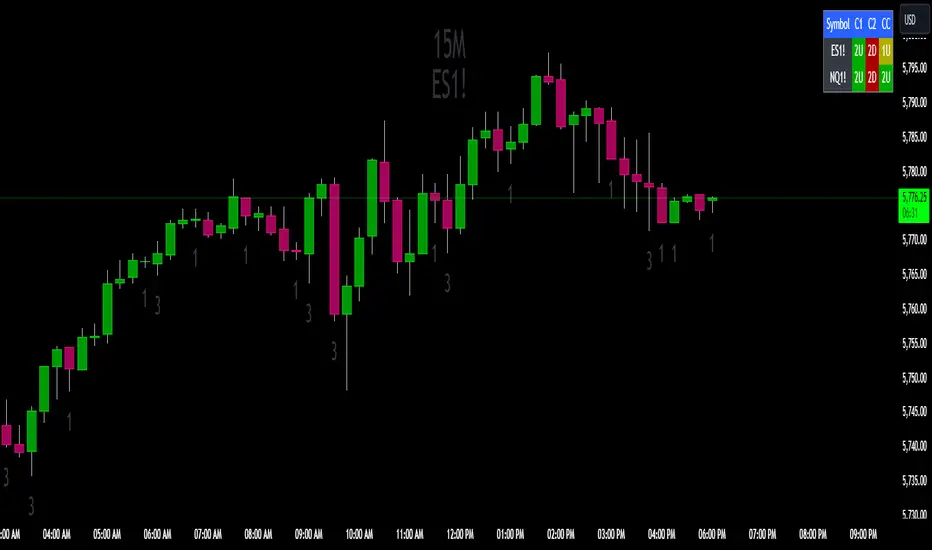
The Strat Candle State Table (Two Symbols)The Strat Candle State Table (Two Symbols) – Multi-Timeframe Analysis
This advanced indicator is designed for traders who follow The Strat methodology, providing a quick, clear, and actionable view of candle states across two selected symbols and a chosen timeframe. It allows you to seamlessly integrate multi-symbol analysis into your trading, offering real-time insights into price action and market momentum based on **The Strat’s** powerful principles.
What It Does:
For each selected symbol, the indicator retrieves and analyzes the price data for three candles:
- Candle 1 (C1): The third candle from the current one.
- Candle 2 (C2): The candle directly before the current one (previous candle).
- Current Candle (CC): The live candle, which is still forming.
Using this information, it plots the Scenario 1 (Inside Bar), Scenario 2 (Directional), and **Scenario 3 (Outside Bar)** states for each candle, color-coding them to help you quickly assess market conditions and price action.
Strat Candle States:
- Scenario 1 (Inside Bar): The candle stays within the high and low of the previous candle (indicating consolidation or indecision).
- Scenario 2 (Directional)* The candle breaks either the high (2-up) or low (2-down) of the previous candle, indicating potential continuation in that direction.
- Scenario 3 (Outside Bar): The candle breaks both the high and low of the previous candle, signaling increased volatility and a potential reversal.
Customizable Color Scheme:
The default colors follow these settings (but can be changed to your preference):
- 1U (Inside and Up): Yellow (indicating an inside bar that closed higher).
- 1D (Inside and Down): Orange (indicating an inside bar that closed lower).
- 2U (Two Up): Green if the candle closes higher, Red if the candle closes lower (conflict).
- 2D (Two Down): Red if the candle closes lower, Green if the candle closes higher (conflict).
- 3U (Three Up): Lighter Purple.
- 3D (Three Down): Darker Purple/Magenta.
Each state is dynamically updated based on the actual price action and whether the candle closes above or below the open. Conflict candles (like a 2-up closing red or 2-down closing green) are highlighted, making it easier to spot potential reversals or weakness in the trend.
Timeframe Flexibility:
You can overlay this indicator on any chart regardless of the timeframe. The key is to select the timeframe you want the indicator to plot for when setting up. Whether you're working on a 5-minute chart, daily, or even weekly, the indicator will analyze the candles according to the selected timeframe, giving you the versatility to adapt it to various trading strategies.
Powerful Use Cases:
1. Multi-Symbol Analysis in Real-Time: The Strat Candle State Table displays the candle states for two symbols at once, helping you track multiple instruments without switching charts. This is extremely useful when monitoring correlated assets like SPY and QQQ, or sector-related pairs such as DIA and IWM
2. Seamless Top-Down View: By analyzing the three most recent candles (C1, C2, and the current candle), the indicator allows you to maintain a top-down perspective on price action, spotting setups early and tracking candle state changes across different symbols and timeframes.
3. Enhanced Conflict Detection: The background shading automatically adjusts for conflict candles, such as a 2-up that closes red or a 2-down that closes green. This provides a quick visual cue to warn you when the current trend may be weakening or reversing.
4. Trade Execution Precision: With this table providing constant feedback on price action and candle state, traders can more easily time their entries and exits, whether they are looking for reversals or continuations
5. Focus on Timeframe Continuity: Use this indicator to stay in alignment with The Strat's Timeframe Continuity, ensuring you are trading in the direction of the most aligned candles, across both symbols. This allows for more precise trade management and higher-probability setups.
6. Customizable to Your Strategy: Change the color coding and candle states to match your personal preferences or trading strategy, making this indicator adaptable to your specific needs.
Most Powerful Use Case – Simultaneous Break Detection:
The Strat Candle State Table shines in setups where simultaneous breaks are being monitored across multiple symbols. For example, if both symbols trigger a 2-up or 3-up at the same time, this confirms that momentum is flowing in the same direction for multiple instruments, giving you stronger trade conviction.
By seeing real-time data for two key symbols, you can ensure that you're catching simultaneous breaks, where multiple instruments are signaling the same move. This can be especially effective in index-based trading, where the strength or weakness of multiple sectors or assets must align for a higher probability of success
חפש סקריפטים עבור "the strat"
The Strat The Strat Bar Type Identifier – Pure Price Action Logic
This open-source indicator implements the foundational bar classification of "The Strat" method developed by Rob Smith. It identifies each candle on the chart as one of the three core types used in The Strat:
* Inside Bar (1): The candle’s range is fully within the previous candle’s range. This indicates consolidation or balance and often precedes breakouts or reversals.
* Two-Up Bar (2U): The current candle breaks the previous high but does not break its low. This is considered bullish directional movement.
* Two-Down Bar (2D): The current candle breaks the previous low but not the high. This signals bearish directional movement.
* Outside Bar (3): The candle breaks both the high and the low of the previous candle, signaling a broadening formation and high volatility.
The script plots a character below each candle based on its type:
* "1" for Inside Bar
* "2" for Two-Up or Two-Down (color-coded)
* "3" for Outside Bar
This tool helps traders quickly identify actionable setups according to The Strat method and serves as a foundation for more advanced strategies like the 3-1-2 reversal or 1-2-2 continuation.
All calculations are based purely on price action—no indicators, no smoothing, no lagging elements. It is ideal for traders looking to understand price structure and bar sequencing from a Strat perspective.
To use:
1. Add the indicator to any chart and timeframe.
2. Look for the numbers below the candles.
3. Analyze the sequence of bar types to spot Strat setups.
This script is educational and can be extended with multi-timeframe context, FTFC logic, actionable signals, or broadening formation detection.
Clean, minimal, and faithful to the core principles of The Strat.

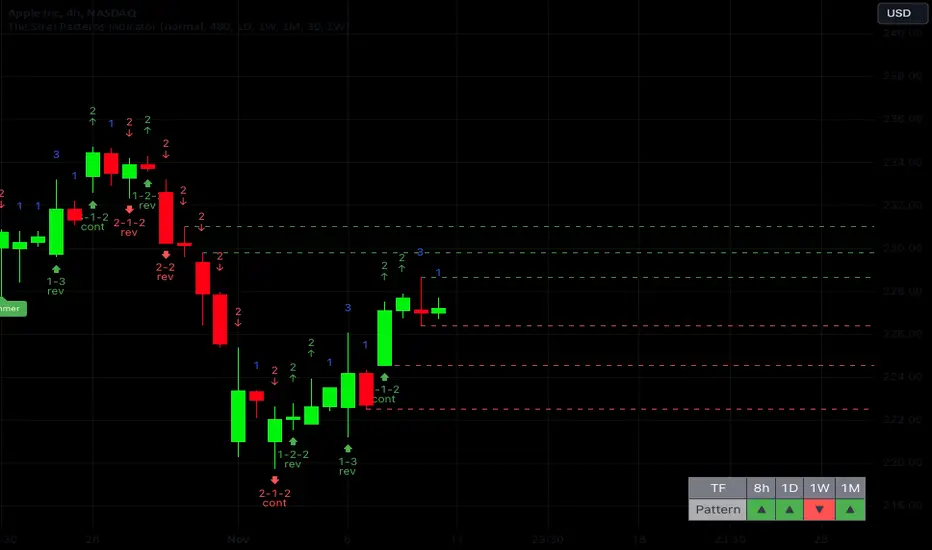
The Strat Patterns Indicator v1.0The Strat Patterns Indicator is a tool that draws Strat patterns in real-time, highlights Strat scenarios, key levels, and helps traders effectively apply the Strat trading strategy.
It combines features such as pattern recognition, timeframe continuity analysis, target level highlighting, and custom alerts to simplify trading decisions and maximize profit potential.
Display All Strat Patterns
The Strat Patterns Indicator shows all Strat patterns directly on your chart, making it easier to spot trading opportunities in real-time. You can choose to show or hide specific patterns based on your preferences. The patterns include:
2-2 Continuation
2-2 Reversal
3-2-2 Reversal
2-1-2 Continuation
2-1-2 Reversal
1-2-2 Reversal
3-1-2 Continuation
1-3 Reversal
3-1-2 Reversal
Highlight Major Candlestick Patterns
The indicator highlights important candlestick formations that are crucial for forecasting the major trend reversals in the market. These candlestick patterns include:
Hammer
Shooting Star
Doji
Gravestone Doji
Dragonfly Doji
Morning Doji Star
Evening Doji Star
By showcasing these patterns, the indicator helps traders quickly identify possible reversals or continuations, providing an extra layer of confirmation for trading decisions.
Timeframe Continuity Table
This indicator includes a customizable table that displays timeframe continuity, allowing you to align your trades with the overall market trend. You can select up to four higher timeframes to monitor, helping you ensure that your trades follow the broader trend direction.
This feature makes it easy to identify whether the market trend is aligned across multiple timeframes, enhancing your ability to make high-probability trades.
Show Target Levels (Previous Highs/Lows)
The indicator highlights target levels based on previous highs or lows, making it easier to set realistic profit targets and manage trades effectively.
By identifying these key levels, you can better gauge potential price movements and plan your trades with greater precision, ensuring that you maximize profit opportunities while minimizing risk.
Highlight Higher Timeframe Target Levels
This feature allows you to display target levels from a higher timeframe while trading on a lower timeframe.
For example, if you are trading on a 4-hour chart, you can choose to show daily target levels, including high/low levels and Fibonacci golden ratios. This helps you identify more significant profit targets and enhances your ability to capture larger moves while staying aligned with the overall trend.
Breakout Confirmation
The indicator provides an option to display the previous candlestick's high or low value, helping you confirm breakouts in Strat patterns. This feature is useful for validating whether a true breakout has occurred, giving you greater confidence in your trade entries and helping you avoid potential false breakouts.
Alerts for Strat Patterns
With this feature, you can set up alerts that trigger whenever a Strat pattern forms. This ensures you never miss a trading opportunity, keeping you informed and ready to act when key patterns emerge. The alerts provide real-time notifications, allowing you to stay on top of market movements without constantly monitoring your charts.
The Strat [LuxAlgo]The Strat indicator is a full toolkit regarding most of the concepts within "The Strat" methodology with features such as candle numbering, pivot machine gun (PMG) highlighting, custom combo highlighting, and various statistics included.
Alerts are also included for the detection of specific candle numbers, custom combos, and PMGs.
🔶 SETTINGS
Show Numbers on Chart: Shows candle numbering on the chart.
Style Candles: Style candles based on the detected number. Only effective on non-line charts and if the script is brought to the front.
🔹 Custom Combo Search
Combo: User defined combo to be searched by the script. Combos can be composed of any series of numbers including (1, 2, -2, 3), e.g : 2-21. No spaces or other characters should be used.
🔹 Pivot Machine Gun
Show Labels: Highlight detected PMGs with a label.
Min Sequence Length: Minimum sequence length of consecutive higher lows/lower highs required to detect a PMG.
Min Breaks: Minimum amount of broken previous highs/lows required to detect a PMG.
Show Levels: Show levels of the broken highs/lows.
🔹 Pivot Combos
Pivot Lookback: Lookback period used for detecting pivot points.
Right Bars Scan: Number of bars scanned to the right side of a detected pivot.
Left Bars Scan: Number of bars scanned to the left side of a detected pivot.
🔹 Dashboard
Show Dashboard: Displays statistics dashboard on chart.
Numbers Counter: Displays the numbers counter section on the dashboard.
Pivot Combos: Displays pivots combo section on the dashboard.
%: Display the percentage of detected pivot combos on the dashboard instead of absolute numbers.
Pivot Combos Rows: Number of rows displayed by the "Pivots Combo" dashboard section.
Show MTF: Showa MTF candle numbering on the dashboard.
Location: Location of the dashboard on the chart.
Size: Size of the displayed dashboard.
🔶 USAGE
This script allows users with an understanding of The Strat to quickly highlight elements such as candle numbers, pivot machine guns, and custom combos. The usage for these concepts is given in the sub-sections below.
🔹 Candle Numbers
The Strat assigns a number to individual candles, this number is determined by the current candle position relative to the precedent candle, these include:
Number 1 - Inside bar, occurs when the previous candle range engulfs the current one.
Number 2 Up - Upside Directional Bar, occurs when the current price high breaks the previous high while the current low is lower than the previous high.
Number 2 Down - Downside Directional Bar, occurs when the current price low breaks the previous low while the current high is higher than the previous low.
Number 3 - Outside bar, occurs when the current candle range engulfs the previous one.
The script can highlight the number of a candle by using labels but can also style candles by depending on the candle number. Inside bars (1) only have their candle wick highlighted, directional bars (2) (-2) only have their candle body highlighted. Outside bars have their candle range highlighted.
Note that downside directional bars are highlighted with the number -2.
Users can see the total amount of times a specific candle number is detected on the historical data on the dashboard available within the settings, as well as the number of times a candle number is detected relative to the total amount of detected candle numbers expressed as a percentage.
It is also possible to see the current candle numbers returned by multiple timeframes on the dashboard.
🔹 Searching For Custom Combos
Combos are made of a sequence of two or more candle numbers. These combos can highlight multiple reversals/continuation scenarios. Various common combos are documented by The Strat community.
This script allows users to search for custom combos by entering them on the Combo user setting field.
When a user combo is found, it is highlighted on the chart as a box highlighting the combo range.
🔹 Pivot Combos
It can be of interest to a user to display the combo associated with a pivot high/low. This script will highlight the location of pivot points on the chart and display its associated combo by default. These are based on the Pivot Combo lookback and not displayed in real-time.
Users can see on the dashboard the combos associated with a pivot high/low, these are ranked by frequency.
🔹 Pivot Machine Gun (PMG)
Pivot Machine Guns (PMG)s describe the scenario where a single price variation breaks the value of multiple past successive higher lows/lower highs. This can highlight a self-exciting behavior, where even more past successive higher lows/lower highs get broken.
Users can select the minimum sequence length of successive higher lows/lower highs required for a PMG to be detected, as well the amount of these successive higher lows/lower highs that must be broken.

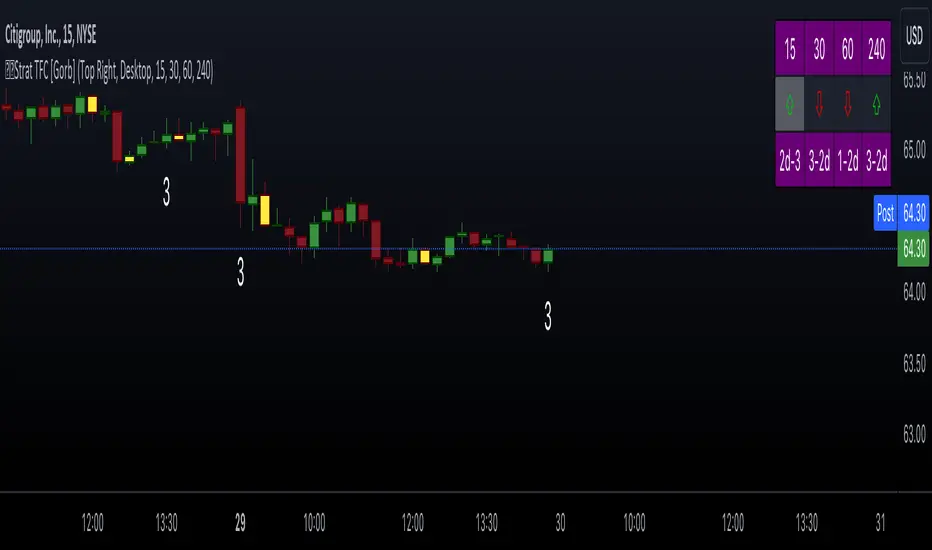
The Strat with TFC & Combo DashIntroduction:
This indicator is designed to implement "The Strat" trading strategy combined with a Timeframe Continuity Dashboard and Combo Dashboard. The Strat is a robust trading methodology that relies on price action and candlestick formations to make trading decisions. This script helps traders to identify specific bar types such as Inside Bars (1), Continuation Up Bars (2u), Continuation Down Bars (2d), and Outside Bars (3) across multiple timeframes. It visually highlights these bar types on the chart and provides a comprehensive dashboard displaying the current state of the selected timeframes.
Key Features:
Timeframe Continuity Dashboard: Displays arrows and bar types for up to four selected timeframes.
Strat Combos Dashboard: Shows the previous and current bar types to easily spot trading setups.
Customizable Colors and Labels: Options to personalize the colors and labels for Inside and Outside bars.
Adjustable Dashboard Position and Size: Allows users to set the location and size of the dashboard for better visual alignment.
Inputs:
TFC & Combo Dash Configuration:
Show TFC & Combo Dashboard: Toggle to display the dashboard.
Show Strat Combos: Toggle to display Strat combo setups.
Location: Dropdown to select the position of the dashboard on the chart.
Size: Dropdown to choose between desktop and mobile view.
Timeframe Selection:
Timeframe 1: Primary timeframe for analysis.
Timeframe 2: Secondary timeframe for analysis.
Timeframe 3: Tertiary timeframe for analysis.
Timeframe 4: Quaternary timeframe for analysis.
Candle Visuals:
Show Inside Bar Label: Option to show label instead of color for Inside bars.
Inside Bar Color: Color picker for Inside bars.
Show Outside Bar Label: Option to show label instead of color for Outside bars.
Outside Bar Color: Color picker for Outside bars.
TFC & Combo DashboardFunctions:
The script fetches values for the selected timeframes and computes the bar types and corresponding visual elements such as arrows and background colors. The dashboard displays this information in a tabular format for easy reference during trading.
The dashboard is dynamically created based on user input for position and size. It shows the selected timeframes, bar types, and combo setups, providing a quick overview of the market conditions across multiple timeframes.
Timeframes: Displays the four user chosen timeframes that the dashboard fetches data from.
Arrow and Color: Functions to set the arrow direction and color based on current bar action. Green and up arrow: price is above it's candle open.
Red and down arrow: price is below it's candles open.
Background Color: Functions to set background color based on the bar type. White for an outside bar(3), yellow for an inside bar(1), no color for a continuation bar(2).
Strat Candle Combos: Functions to determine if the bar is an Inside(1), Continuation Up(2u), Continuation Down(2d), or Outside bar(3). Shows the previous bar and the current bar for the user's chosen timeframes.
Candle Visuals:
The script plots labels and colors for Inside and Outside bars based on user preferences. It helps in quickly identifying potential trading setups on the chart.
Conclusion:
We believe in providing user-friendly tools to help speed up traders technical analysis and implement easy trading strategies. The Strat with TFC & Combo Dashboard is a tool to assist traders in identifying potential trading setups based on The Strat methodology; to suit the users needs and trading style.
RISK DISCLAIMER
All content, tools, scripts & education provided by Gorb Algo LLC are for informational & educational purposes only. Trading is risk and most lose their money, past performance does not guarantee future results.
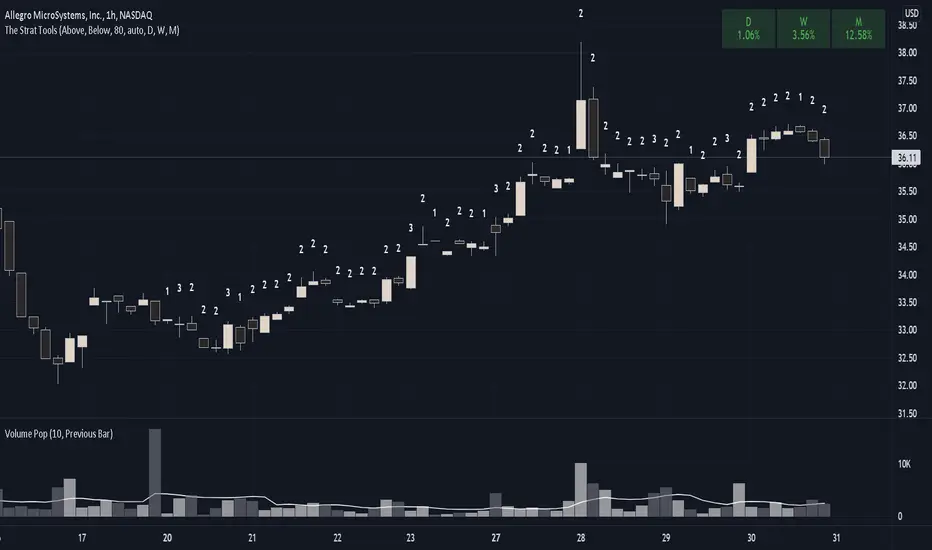
The Strat ToolsThis indicator will be collection of tools for using Rob Smith's The Strat.
Currently only bar numbers is implemented.
Every individual tool can be enabled or disabled and customized.
#TheStrat
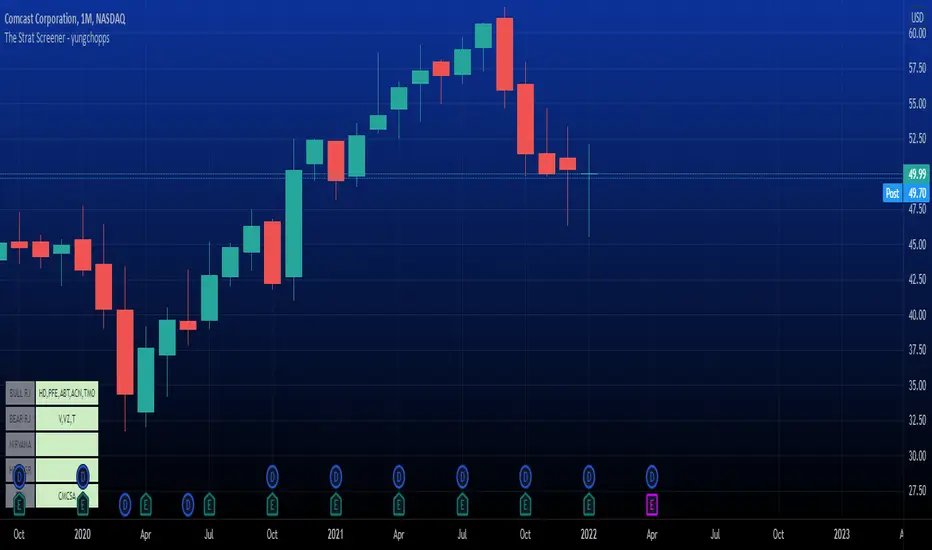
The Strat Screener - yungchoppsThis indicator scan up to 40 tickers of your choice for bullish and bearish Randy Jackson setups. Randy Jackson setups are 2u-2u-2d-2u for bullish cases and 2d-2d-2u-2d for bearish cases. If a ticker has a possible RJ setup, the ticker name will be display on the table depending if it is bullish or bearish. The only thing you need to do it change one of the default tickers to the ones you desire and the table will update if there are any RJ setups. The indicators search for RJ setups on the current timeframe that you are on.
Randy Jackson setups are part of the 'Strat' candlestick analysist. More information about the Strat can be found on the internet and YouTube. This indicator reads the previous candles of every selected ticker and searched for a RJ setup. If one exist, it will update the table with the tickers name. I will add more setups in the future.
This is a screener. This indicator really just makes it easier to scan many indicators at once. Its not hard to use... just place it on the chart and it will do the work for you. Hopefully mods find this enough of a description...
The Strat Numbers & CombosThis indicator is an all-in-one " The Strat " script. This script displays the following:
The Strat candle numbers (1's, 2's, & 3's)
The Strat Combo labels along with trigger line
Pivot Machine Gun ( PMG ) dynamic labels
Hammer & Shooter candle labels
The Strat Candle Numbers label each candle, on any timeframe, either a 1, 2, or 3. 1's are inside bars of the previous candles. 2's take out only one side of the previous candle. And 3's go outside both sides of the previous candle.
The Strat Combo labels (which are made of the 1's, 2's, 3's outlined above) display labels when a Strat Combo occurs. The script displays a label, direction arrow, and trigger line for each Strat Combo. This indicator finds the following Strat Combos:
2-1-2 bullish reversal (BLR)
2-1-2 bullish continuation (BLC)
3-1-2 BLR
3-2-2 BLR
1-2-2 rev strat BLR
2-2 BLR
2-1-2 bearish reversal (BRR)
2-1-2 bearish continuation (BRC)
3-1-2 BRR
3-2-2 BRR
1-2-2 rev strat BRR
2-2 BRR
Double inside candles
The Pivot Machine Gun (PMG) labels any 5 or more consecutive candles that make higher lows or 5 or more consecutive candles that make lower highs. A PMG can continue going in its direction or it can reverse and come back through the range. The logic in this indicator dynamically finds each level in a PMG and draws a line for easy identification.
The script also identifies if the candle type is a Hammer, Inverted Hammer, Shooting Star, or Hanging Man. These candle types are highly likely reversal points in price action.The indicator will plot a shape with a color coded icon identifying the candle. The distance between the shape and the candles can be manually adjusted in the inputs section.
This indicator has many style options . The user can independently toggle on/off the Strat numbers, boxes around the Strat Combos, and Hammer and Shooter shapes. Also all of the colors used in this script can be changed from the inputs section, so a user can easily change colors to match their current color scheme.

The Strat info boxThis indicator is an all in one indicator for the "The strat" method by Rob Smith. This indicator DOES NOT provide trading advice or trade entry signals!
What is included:
* Candle Type 1 - Inside Candle
* Candle Type 2- Up or Down Candle
* Candle Type 3 - Engulfing Candle
* Strat signal:
- 2-1-2 setup
- 3-2-2 setup
* Full Timeframe Continuity:
- from a 5min timeframe to a yearly timeframe. Green gives you an uptrend, Red a downtrend.
* middle of day and week
- this give you a support and resistance level at the middle of the day or week. This is a good indicator if the stock goes up or down
* extra info like:
- ATR of 14 days
- DTR of current day
- Volume info
- Float info
NASDAQ:FB

The Strat with Continuity [starlord_xrp]This indicator shows entry and exit points for The Strat as well as potential setups. It also has full time frame continuity detection.

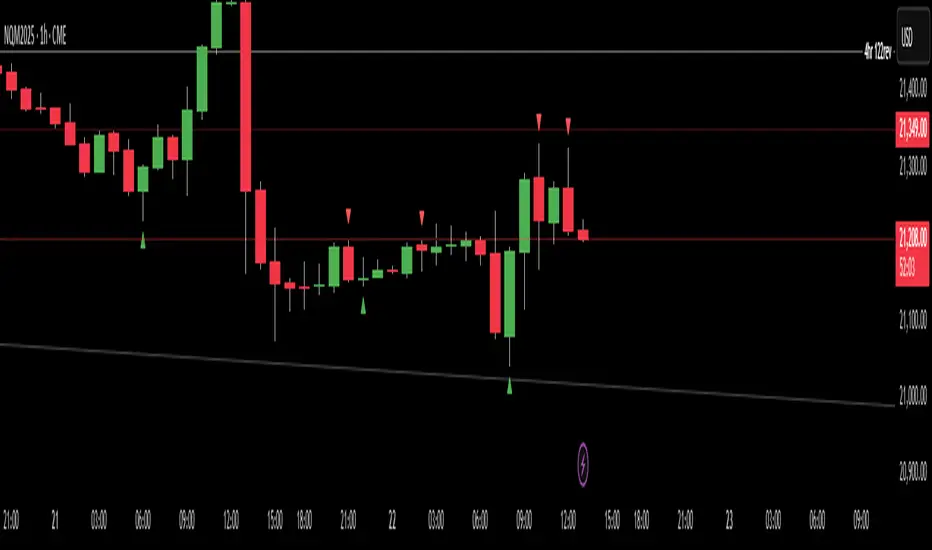
Failed 2s - The StratDescription:
This indicator detects and highlights "Failed 2" candlestick patterns from The Strat methodology — key price action setups signaling potential reversals or continuation points. It automatically identifies Failed 2 Down (Failed 2D) and Failed 2 Up (Failed 2U) signals by analyzing two consecutive bars, with special attention to price interaction at the 50% midpoint of the previous candle.
Visuals:
- Green upward triangles mark Failed 2 Down signals (bullish setups).
- Red downward triangles mark Failed 2 Up signals (bearish setups).
- Special signals that touch the 50% midpoint of the previous candle are emphasized but use the same shapes.
Alerts:
Built-in alert conditions let you receive notifications when these patterns occur, so you never miss a trade opportunity.
How to Use ALERTS in TradingView
- Paste this code into Pine Editor on TradingView.
- Click Add to Chart.
Set alerts:
- Click "Alerts" → "Condition" = your indicator name
- Choose the alert type (e.g. "Failed 2D Bar Alert")
- Set "Once per bar close"
- Customize the notification method (pop-up, app, email, etc.)
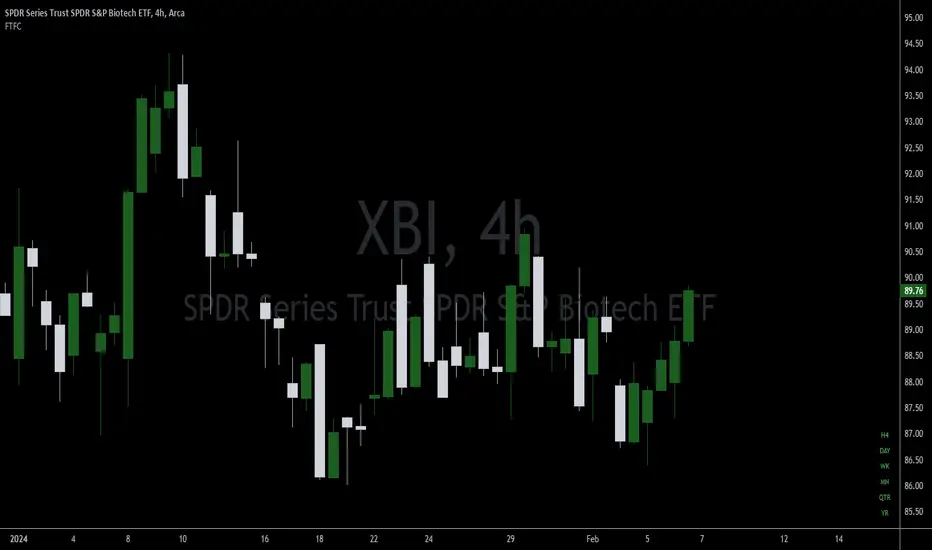
FTFC (The Strat)This indicator provides the status (red="down/short", green="up/long") of the current and higher timeframes in conjunction with The Strat, created by Rob Smith. In The Strat, Rob states that one should trade in the direction of timeframe continuity. What this means is if the majority of higher time frames are trading to the upside, one should only take long positions on the current timeframe. The more timeframes trading in the same direction increases the likelihood that a trade will work out in the trader's favor. The purpose of this indicator is to provide a visual cue as to when the current symbol has reached Full Timeframe Continuity (FTFC). For example, M5, M15, M30, H1 all green, only take long trades on the M5 time frame.
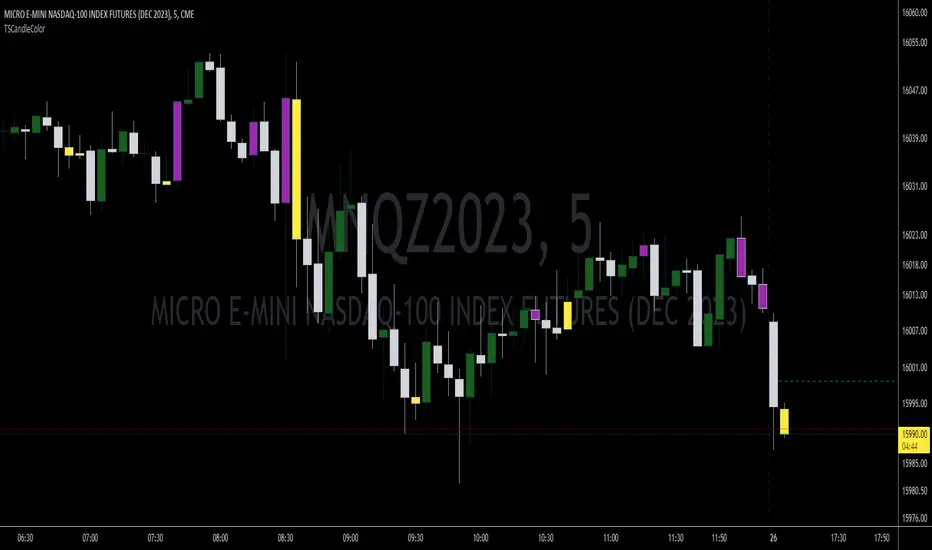
TSCandleColor (The Strat)This indicator highlights 1 and 3 candles based on The Strat, created by Rob Smith. In The Strat, candles can only take one of 3 forms, an inside bar or a '1' where the high and low of the current candle are within the high and low of the previous candle, an outside bar or a '3' where the high and low of the current candle are outside of the previous bar, and a '2' bar where either the high or low of the current candle surpasses the previous candle but not both. Since '1' and '3' bars are key to many setups, this script highlights those candles. Highlighted colors are configurable by the user. This indicator further draws a line at the 50% mark of the previous candle for use in conjunction with the teachings of Sara Strat Sniper and her 50% rule. Her 50% rule states that when a '2' candle passes the 50% mark of the previous candle there is a high likelihood of that '2' candle becoming a '3'. Having this already drawn on the chart with each new candle makes it much easier to see this real-time. The color and style of the 50% line is also configurable.
FTFC Watchlist (The Strat)This indicator is a five custom ticker watchlist that shows seven pre-defined higher timeframes using '#TheStrat' technique and can be used on any ticker from common stock, forex and crypto.
Explanation of 'TheStrat' trading technique
‘TheStrat’ technique works off the basis of labelling whether the focus candle did or did not break any of the previous candles high or low values. There are three possible label definitions; either a 1 candle, 2 candle or a 3 candle.
1 bar (inside) - If price movement on the new candle remains within the high and low of previous candle.
3 bar (outside) – If price movement went above both the high and the low of the previous candle.
2 bar (directional) – If price movement only broke with the high (called a 2-up) or if price movement only broke the low of the previous candle (called a 2-down).
Once labelled the technique then looks for certain combination of these labelled candles (called actionable setups) such as: 2-1-2, 1-2-2, 3-1-2.
What is Full Time Frame Continuity (FTFC)
Under 'The Strat' full timeframe continuity is limited to the colour (open vs close) of the candle being either green or red. When higher timeframe align with the 'same colour' is suggest that there is stronger support for that direction of the candle.
How does the indicator work?
The indicator will allow you to daily enter up to 5 watchlist tickers and in as close to real time (slight lag) show the developing FTFC of your watchlist tickers and avoids having to switch chart tickers to see the developing timeframe continuity
Example of how to use the indicator
A simple example will be the relationship between SPY and VIX and by having the higher timeframe overview of these two watchlist tickers while trading will give potential insights to how the market is trading overall.
Some people might also find it useful to see 'consolidation' (1 bar) and 'expansion' (3 bar) highlighted in the timeframe. This feature can be enabled in the settings.
Indicator caveats:
= Must run on 5min (or lower) chart timeframe. If not indicator will produce 'runtime error'.
= Weekly computation is not 100% reliable due to bug in TV when a month end occurs mid week.
= Please change the indicator colour if used on a non-dark theme.
= Please note this information is only presented for educational and learning purposes. It is by no means financial advice or provide any form of trading signals.
TO ENABLE , please follow these steps:
1) Add indicator to your chart and open settings
2) Enter which tickers (max 5) you wish to add to your watchlist by enabling the checkbox
3) Decide on the timeframes you wish to view
4) Configure the colouring of the watchlist.
Hope this indicator provides useful and educational information and helps to improve your overall access to information.

Paint 1 & 3 Bars (The Strat)Based on 'The Strat' methodology by Rob Smith.
This script will paint 1 & 3 bars per 'The Strat'.
N.B. Per 'The Strat' a bar is seen as a 1 (inside) when the bar's high or low is an equal tick to the previous bar.

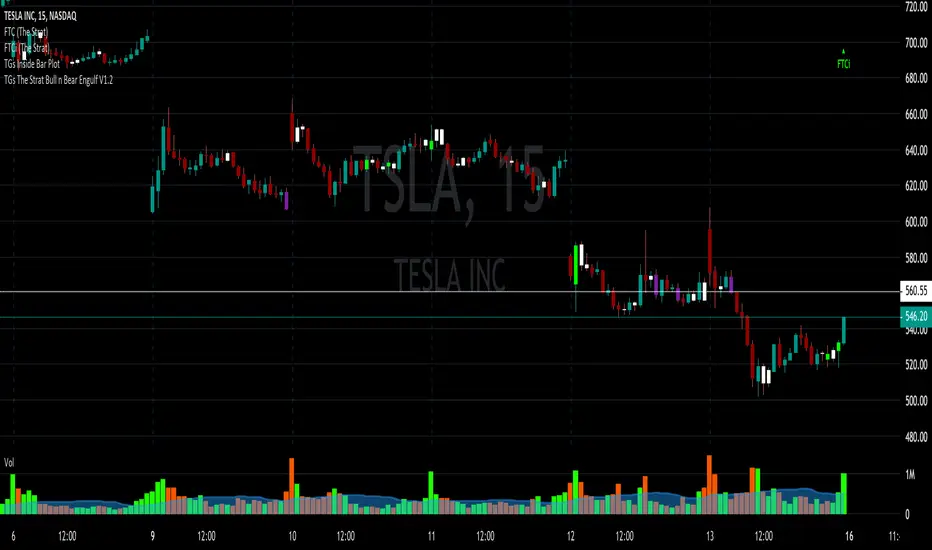
TGs The Strat Bull n Bear Engulf V1.2After accidentally violating house rules. I am republishing the script.
The script is based upon #TheStrat, which is Rob Smith's way of looking at price action.
It takes into account a candles ENTIRE range, wicks included.
So a Bullish candle (colored however you would like) when it closes will engulf the complete
range of the prior bar and indicate by painting the bar your color choice.
A Bearish will do the same.
In the Style menu, the first color will be the Bear color the second the Bull.
Any issues please let me know. Spread THE STRAT for all of mankind.
Price Continuation (The Strat)Shows the historic bar type, whether it is up, down, up and inside, down and inside, up and outside, or down and outside. Will only display historic bar type based on the selected time timeframe. (Ex. if you are looking at the weekly time frame, you will only see the bar type for Year, Quarter, Month, and Week. It will not display the Day or Hour bar type.)

BB with5-10-50-100-200 SMA Daily and the StratThis script combines Bollinger bands with 5 different SMA (5,10,50,100,200) with indicators for when candles are inside day or outside day i.e the Rob Smith's 1 and 3 in "the Strat"

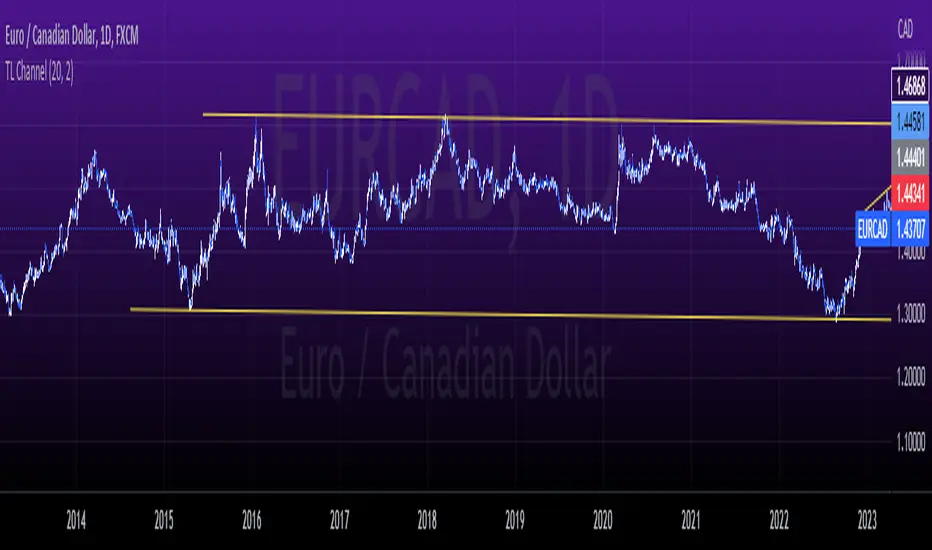
tlc with False BreakoutThe strategy aims to identify a trend line channel with the potential for a false breakout. Here's an explanation of the strategy:
The script starts by defining the input parameters. The lookback parameter determines the number of previous bars to consider for detecting the trend lines, and the threshold parameter controls the sensitivity of the trend line detection.
The script then initializes variables to store the trend lines, tap count, and the false breakout signal.
Inside the loop, the script iterates over the specified number of bars (lookback) to identify the trend lines. It checks if the current high is greater than the previous and next highs to identify an upper trend line and sets it using the line.new function. Similarly, it checks if the current low is smaller than the previous and next lows to identify a lower trend line and sets it.
The script also keeps track of the price levels of the upper and lower trend lines using the variables upperTrendLinePrice and lowerTrendLinePrice. These price levels are obtained using the line.get_y1 function.
After the fourth tap (when tapCount is equal to 4), the script checks if the current close price is above the upper trend line or below the lower trend line. If this condition is met, it sets the falseBreakout variable to true, indicating a potential false breakout.
Finally, the script plots a shape marker (plotshape) when a false breakout occurs. This is represented by an orange label displayed below the bar.
At the end of the script, the line.delete function is used to remove the old trend lines when the script reaches the last bar (barstate.islast).
By using this strategy, you can visually identify trend line channels where the upper and lower lines touch higher highs or lower highs and higher lows or lower lows. Additionally, it provides a false breakout signal when the price breaks above the upper trend line or below the lower trend line on the fifth tap.
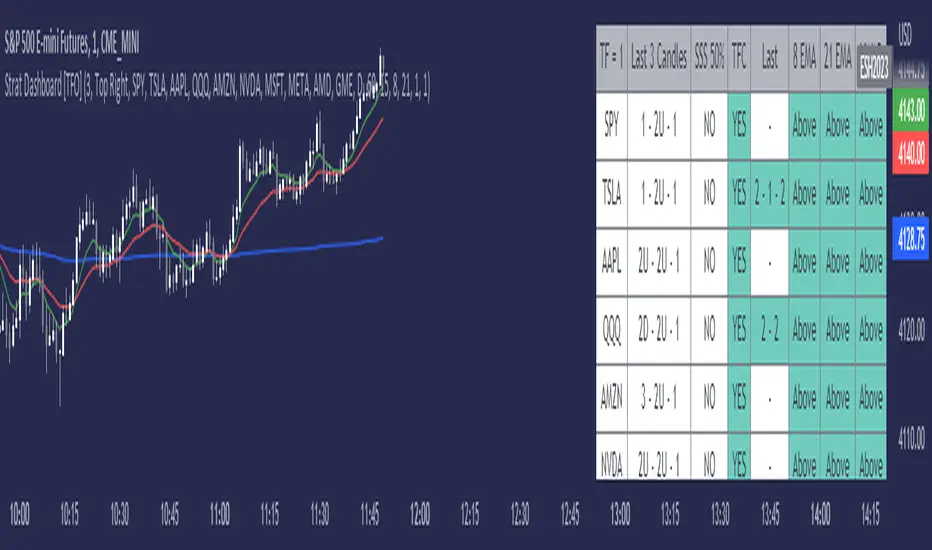
Strat Dashboard [TFO]The Strat Dashboard tracks up to 10 signals while highlighting common strat reversal patterns, the SSS 50% rule, timeframe continuity, and some additional criteria with VWAP and moving averages.
With the strat, all price action bars/candles are simplified into 3 total possibilities: 1 (inside bar), 2 (a bar that takes the previous bar's high OR low), and 3 (outside bar). The first table column for Last X Candles shows the most recent candles according to this notation, for example, 1 - 2D - 2U. This would mean we had an inside bar, followed by a bar that took the previous bar's low, followed then by a bar that took the previous bar's high. Note that the colors in this column are set according to whether the current bar's close exceeds the previous bar's high/low. By default, these colors are green if above the previous bar's highs, or red if below the previous bar's lows. If the current close is in between the previous candle's high and low (even after already taking the prior high or low), no color will be applied.
The SSS 50% column shows a yes or no value for whether the current bar aligns with the SSS 50% rule, where a bar has taken either the previous high or low, and has since reversed to at least the midway point of the previous bar's height - essentially anticipating a 2 that may become a 3 (outside bar).
Timeframe continuity (TFC) shows a yes or no value for when the current candle on multiple timeframes are all green or red (above the open price or below the open price, respectively). For example, if you were looking at the current 15m, 1h, and 1D bars, and they were all above the open price, you could say there's TFC between all three timeframes. As of the initial release, you can select up to 3 different timeframes. The table values will only be true when all selected timeframes are in alignment. When setting alerts, first deselect the timeframes if you don't want TFC logic to impact alerts.
The "Last" column shows the last strat reversal pattern that was confirmed (after the last bar closes). Waiting for a candle close is the safer option since a 2 can turn into a 3; however for higher timeframes, it may be beneficial to make an update to this indicator in which you can have live alerts as well (not waiting for a candle close). You can select which strat reversals you want to be shown from the settings. Various strat reversals may be selected for alerts of type "Any"; for example, if setting up an alert for "Any" strat reversal on Symbol 1, then this alert will go off when any of the *selected* strat reversals occur for that specific symbol. Deselect any strat reversals that you don't want to be included in these alerts.
Lastly, the EMA and VWAP columns simply show whether price is above or below said value. This tracks the current candle close, and may repaint/change several times if the current bar is oscillating above and below these values.
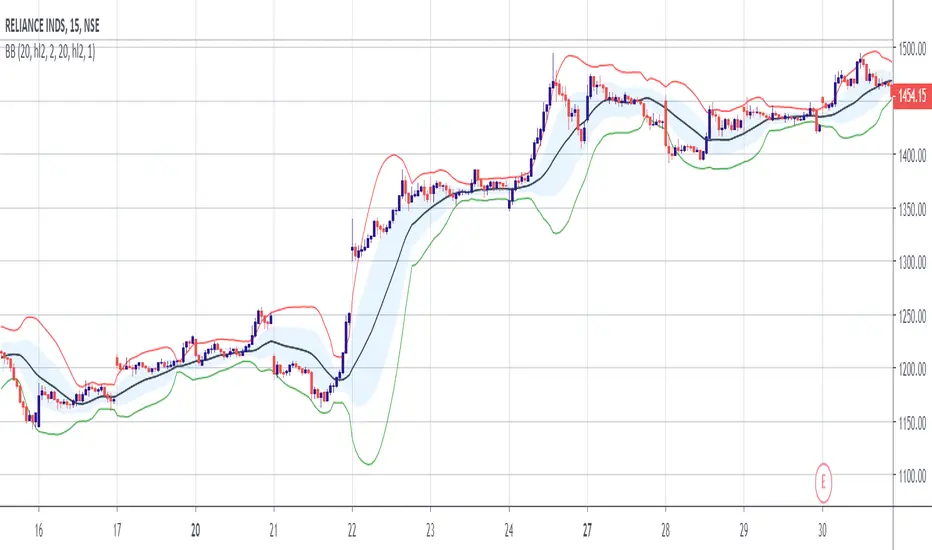
Double Bollinger Bands StrategyThe Strategy involves two Bollinger Bands (BB) at a go.
One with Divergence of 1 and another 2.
Strategy:
When the price rides above the inner BB, buy, check if it rides above the second BB. Exit when price falls inside the Outer BB and enters the Inner BB.
When the price rides below the inner BB, buy, check if it rides below the second BB. Exit when price rises inside the Outer BB and enters the Inner BB.
Bullish and Bearish Candlestick Patterns StrategyThe strategy is a combination of candlestick pattern analysis and Fibonacci retracement levels to identify potential buy and sell signals in the market. Here's how the strategy works and how you can trade accordingly:
Candlestick Pattern Analysis:
The strategy looks for specific bullish and bearish candlestick patterns to identify potential trend reversals or continuations. The bullish patterns include:
Bullish Engulfing: This pattern occurs when a bullish candle fully engulfs the previous bearish candle.
Hammer: It is a single candlestick pattern with a small body and a long lower wick, indicating a potential bullish reversal.
Morning Star: This pattern consists of three candles, with the middle one being a small-bodied candle that gaps down and the other two being bullish candles.
The bearish patterns include:
Bearish Engulfing: Similar to the bullish engulfing, but this time, a bearish candle fully engulfs the previous bullish candle.
Shooting Star: A single candlestick pattern with a small body and a long upper wick, suggesting a potential bearish reversal.
Evening Star: This pattern is the opposite of the morning star, with a small-bodied candle that gaps up between two bearish candles.
Fibonacci Retracement Levels:
The strategy uses Fibonacci retracement levels to determine potential support and resistance levels in the market. The main level considered in this strategy is the Fibonacci 0.5 level, which is the midpoint of the previous swing move.
Trading Accordingly:
To trade using this strategy, follow these steps:
a. Observe the Chart: Apply the indicator to your preferred chart, and observe the candlestick patterns and the plotted support, resistance, and Fibonacci 0.5 levels.
b. Buy Signal: A buy signal is generated when any of the bullish candlestick patterns (Bullish Engulfing, Hammer, Morning Star) occur, and the low price of the current candle is above or equal to the Fibonacci 0.5 level. This suggests a potential bullish reversal or continuation of an existing uptrend.
c. Sell Signal: A sell signal is generated when any of the bearish candlestick patterns (Bearish Engulfing, Shooting Star, Evening Star) occur, and the high price of the current candle is below or equal to the Fibonacci 0.5 level. This indicates a potential bearish reversal or continuation of an existing downtrend.
d. Risk Management: Place stop-loss orders to protect your position in case the market moves against your trade. Consider setting the stop-loss below the recent swing low for buy trades and above the recent swing high for sell trades.
e. Take Profit: Set a target for taking profits based on your risk-reward ratio. You can use the recent swing high for buy trades as a potential target and the recent swing low for sell trades.
f. Filter Signals: Keep in mind that not all signals will result in profitable trades. It's essential to filter signals with other technical analysis tools and consider the overall market context.
Remember that no trading strategy guarantees profits, and trading always carries inherent risks. It's crucial to practice proper risk management, use appropriate position sizing, and test the strategy thoroughly in a demo environment before applying it to live trading. Additionally, consider combining this strategy with other indicators or analysis methods to make more informed .

DJ Soori Trading StrategyThe strategy combines three indicators: Exponential Moving Average (EMA), Weighted Moving Average (WMA), and Average Directional Index (ADX).
The EMA and WMA are used to track the average price over different time periods.
The ADX measures the strength of a trend in the market.
The strategy generates buy signals when the EMA is higher than the WMA and the ADX is above a certain threshold. It suggests a potential uptrend.
It generates sell signals when the EMA is lower than the WMA and the ADX is above the threshold. It suggests a potential downtrend.
The strategy also considers whether the ADX is rising or falling to indicate the strength of the trend.
The EMA, WMA, and ADX values are plotted on the chart.
Buy and sell signals are shown as labels on the chart, indicating "Buy (Strong)" or "Buy (Weak)" for buy signals, and "Sell (Strong)" or "Sell (Weak)" for sell signals.
